By DataKind San Francisco
How can we better understand equity in local governments and the resources they provide to our communities?
The City of San José is the tenth most populous city in the U.S., and one of the most diverse. The City of San José’s Mayor’s Office of Technology & Innovation (MOTI) aims to hold their City government accountable to providing equitable services to its residents. MOTI focuses specifically on data equity, which is defined as using the City’s data ethically and in ways that drive equitable outcomes for their constituents. Read more about how the City works toward equitable outcomes here.
In collaboration with DataKind San Francisco, MOTI launched an open data standard and framework for equity-focused analyses—a publicly accessible system to understand the quality of government services in San José by location and communities served.
Last month, the DataKind San Francisco and MOTI partnership was discussed in the City of San José’s Smart Cities Committee Meeting. For more information, see the meeting report and hear a shout out (at the 1:24:40 mark) from the City’s Digital Privacy Officer during the meeting.
An Open System for Understanding Public Data
The San José Open Data Portal houses a wealth of data about the city. Though datasets are carefully curated by each of the contributing departments, it can be difficult to dissect the information to understand equity across different applications. Local governments often lack the necessary technical tools to identify and tackle inequities in their communities. Moreover, these tools may not generalize across departments and cities nor be accessible to the public.
To tackle these issues and make discussions and analyses around data equity more accessible to a wider audience, we collaborated on a three-part system that facilitates centralized analyses of publicly available government datasets through:

-
-
-
-
- An open U.S. Census-linked interface to augment data with demographic information
- An open analysis and visualization framework to reduce technical barriers for understanding inequities
- An open data standard to regulate data intake and improve data usability for analyses
-
-
-
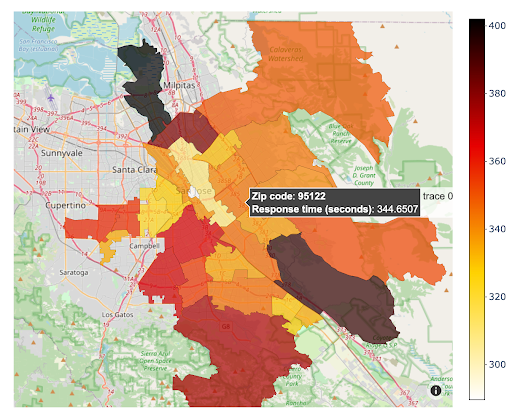
We focused on emergency response times as a measure of equity to demonstrate this open data standard and analysis framework. Emergency response times are an important measure of the quality of government service, and this measure both impacts decisions about future resourcing (e.g., where fire stations are placed) and can be used by community members to highlight strengths and potential areas of improvement for their city government. For example, a New York City resident wrote to their city government that they were concerned about the lack of accessibility to emergency services in their neighborhood, but they couldn’t find a way to download the full dataset. We’re working to help citizens like them.
An Open U.S. Census-linked Interface
Open data users looking to answer questions related to equity struggle with the time-intensive process of bringing in appropriate demographic data to supplement existing datasets. In order to eliminate this barrier, our team developed an open U.S. Census-linked interface. This service provides a customizable workflow that connects existing government datasets to demographic information captured by the U.S. Census. For example, our interface uses latitude and longitude fields from public datasets to generate additional relevant data, such as county median household income level, education level, insurance coverage, race/ethnicity breakdown, etc.
By augmenting local government datasets with demographic information, we can tackle equity-focused issues and more easily identify communities that local departments have historically underserved. Automatically linking Census data with city data removes a technical barrier to accessing, analyzing, and acting upon open data. Our open-source codebase and proof-of-concept web application hosted on Heroku provide this foundation.
.png)
An Open Analysis + Visualization Framework
Those looking to answer specific questions related to resource equity must also develop analysis frameworks and visualizations to better understand the available data, which can pose another barrier to thorough equity analysis. To tackle this, our team built a proof-of-concept equity analysis playbook and visualization tool as a framework to understand local city datasets.
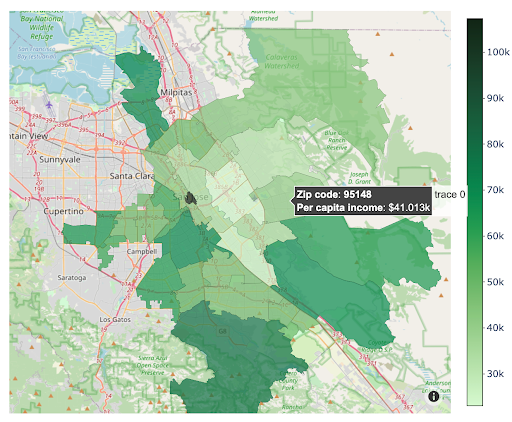
The playbook begins with a “Data Health Check” to provide quick insight into the quality of a dataset, including metrics around missing and inaccurate data points. We’ve then established a set of equity analyses to quantitatively measure government service allocation and the quality of resources provided to different groups. These test for statistically significant differences in resource allocation across groups of zip codes, which are grouped by various demographic factors extracted from Census data, such as race/ethnicity, income, and more. We supplement these analyses with maps that visualize resource allocation and to start, quantitative demographic factors such as income, as shown in Figures 1 and 2.
As a result, our playbook-powered equity analyses are more easily interpretable and granular, which can inform both internal City departments and external groups on the current state of resource equity within local governments.
An Open Data Standard
Finally, we supported the use of San José’s Open Data Portal by balancing the needs of data publishers (i.e., those uploading datasets) with data users (i.e., those looking to use datasets). Common data fields such as district affiliation can be encoded in numerous ways, making data processing more difficult for data users. As such, we proposed a clear and light open data standard, detailing standardized common fields in local government datasets.
Our key design considerations around the open data standard include:
- Clarity (i.e., is this data presented in a simple, human-readable format?)
- Lightweight (i.e., does this data standard follow the format that most City departments currently use, or would it be easy for City departments to adapt their current process to follow the identified practices?)
On October 5, 2021 we published our findings at ACM EAAMO (Association for Computing Machinery’s Conference on Equity and Access in Algorithms, Mechanisms, and Optimization) as an academic paper to gain peer review feedback as well as share our framework to the larger community. We’re excited to share the paper here, and we’re looking forward to continued feedback and collaboration with academics and the City of San José residents alike.
We hope this work can influence future data collection by the City of San José and other local governments to ultimately support greater local transparency. We also aim to bring more accountability and accessibility to the City’s data by open-sourcing our frameworks and data collection workflow. While developing an open data standard and analysis framework is a step forward, there are many ways to generalize this beyond just response times, and this is only a first step to a more equitable San José.

Try it Yourself
Navigate to https://sj-open-data-api.herokuapp.com/ to test the prototype and demo your own equity analyses from San José’s data using this open framework.
The tool conducts data cleaning and augmentation, then outputs an equity analysis and visualization. The inputs include a response time dataset and the appropriate column names, and the output is a PDF containing the analysis and visualization, as shown in Figure 3.
All project resources are open source with research on Google Drive here and the code is hosted in DataKind San Francisco’s GitHub here. The source code has two additional sections that lay the foundation for a future expansion of this work: (1) data health checks, and (2) an added level of analysis with data filters.
Next Steps + Thank You’s
We’re excited to see the realm of possibility for research that builds upon our EAAMO paper! If you’re interested in advancing more equitable policymaking in your communities, get in touch with MOTI (julia.chen@sanjoseca.gov) or DataKind San Francisco (ramya.r813@gmail.com, edwin.james.zhang@gmail.com). We’d love to continue the conversation!
We’d also like to thank representatives from the San José Fire Department, Harvard Kennedy School, the City of Long Beach, Bloomberg Philanthropies, GovLab, and the City of San José for their time and dedication to shaping and supporting this work.
The project team includes Joy Hsu, a tech policy fellow with MOTI, and Edwin Zhang and Ramya Ravichandran, DataKind San Francisco volunteers.
.png)
Joining the DataKind Movement
DataKind’s work is possible through the generosity of our volunteers, donors, and corporate sponsors. If you’re moved and can join us in supporting this and our future important work, please become a donor here. Every gift helps DataKind harness the power of data science and AI in the service of humanity.
- Interested in supporting our work? Donate here.
- Interested in sponsoring a project? Partner with us.
- Interested in volunteering with DataKind? Look no further.
- Interested in working at DataKind? Apply now!
- Interested in submitting a project? Go for it!
Quick Links
- City of San José’s City Council Meeting (highlighting the work of DataKind San Francisco)
- Increasing Data Capacity in the Social Sector: Lessons from DataKind San Francisco’s Launch of DataAdvisory Projects
- Our Ethics + Responsible Data Science Practices at DataKind
- Introducing the DataKind Playbook
- Advancing Alcohol Behavior Change with Data Science
- Analyzing Unregistered User Activity to Better Understand Readers
- Bringing Showers to SF, Oakland, & LA’s Homeless Community
- Volunteer Spotlight: Melinda Tellez
- Volunteer Spotlight: Kelsey Meagher