Background
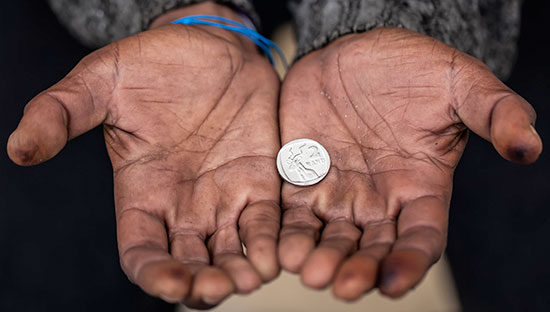
Access to clean water, sanitation, and hygiene (WASH) is critical for healthy and humane living conditions. Clean water and sanitation improves health and supports development in other sectors, such as education (particularly for women and girls), environmental stewardship, and the economy.
Policy decisions around development and financing for WASH programs can have a significant impact for communities with poor access to safe drinking water and basic sanitation. However, it can be challenging to access high-quality data to better target people most in need and to make rigorous decisions when working in remote or rural areas.
Aquaya, a data-driven nonprofit organization operating in 24 countries around the world, was founded to help overcome these challenges by combining data collection, advanced analytics and research to help make informed WASH program, policy, and financing decisions.
DataKind San Francisco was privileged to work with Aquaya throughout 2021 on a project to increase their capacity to gather data in remote areas using satellite imagery.
The Project
In many low or middle-income countries, living standards surveys are lacking. For example, critical information on household income might not be available to governments and NGOs, making it difficult to know which families need support.
This project was focused in Ghana where there are some initiatives to develop WASH subsidies for low-income households, But existing methods to identify poor households usually require intensive fieldwork such as household surveys or community consultation, and are thus difficult to deploy at larger scale. Some examples of poverty predictions at large scale are available in the literature but they do not provide household-level poverty information and remain highly technical.
Our goal was to attempt to overcome this by using satellite imagery to predict household-level poverty in approximately 100 villages in rural Ghana, and to translate these findings into simple tools actionable by practitioners in the field.
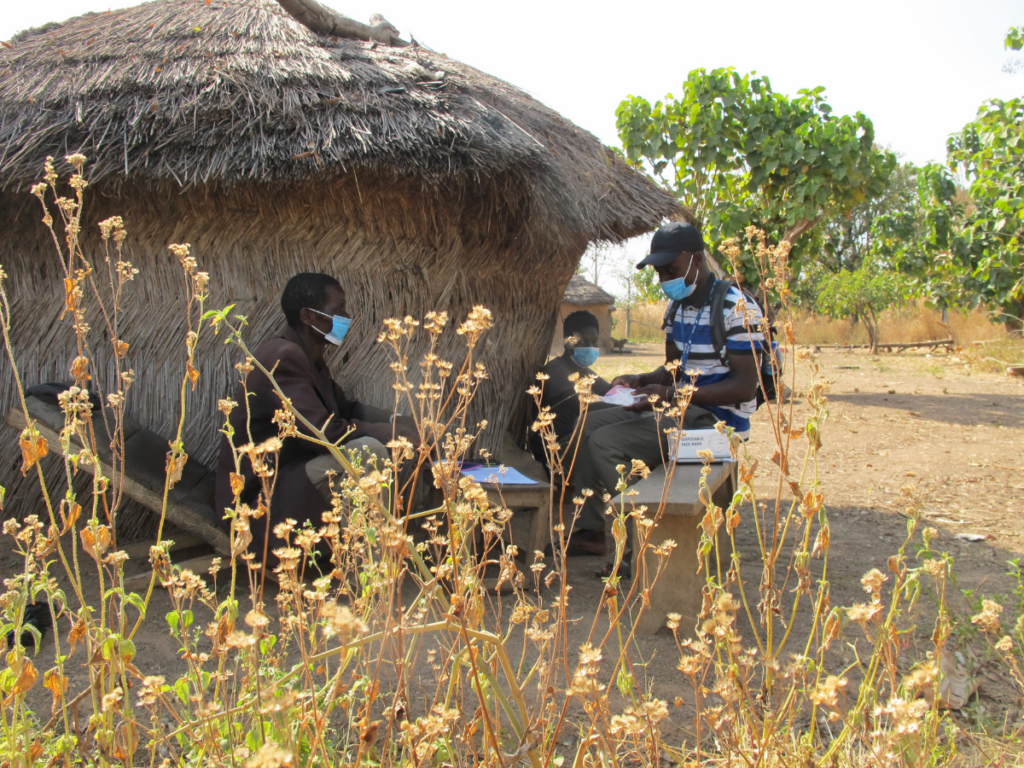
As a first step, Aquaya staff conducted a survey to identify poor households in several villages to create an initial dataset for training a model. The intention was to see if we could build a machine learning model to predict poor households based on this data and satellite imagery, ideally improving Aquaya’s ability to quickly identify eligible households to water and sanitation subsidies in new, un-surveyed villages or regions.

Technical Approach
Satellite Imagery
Due to Aquaya’s status as a nonprofit, they were able to request trial access to imagery from Airbus’s Pleiades constellation, and we were able to access one image of each village.

Footprint Model
A necessary prerequisite for a project of this nature is a “footprint” model that specifies the edges of each building in an area of interest. This allows us to associate surveyed households with a specific building, while also allowing us to make predictions about un-surveyed households.
We initially created our own footprint model using a residual u-net, a kind of convolutional neural network that’s particularly well-suited for semantic segmentation tasks (in other words, predicting the label of each pixel in an image – in our case, whether or not the pixel is part of a building).
After we had already created the custom footprint model, Google announced a project which provides a footprint model for the majority of Africa. We ultimately used a combination of our footprints and Google’s, selecting whichever was the highest quality for a particular village. This required “co-registration” to align Google’s footprints with our satellite imagery, since the Google footprints used a different satellite provider.
Once the footprints were finalized, we had to match the survey coordinates to the nearest footprint. This posed an additional challenge, as in many cases it was non-trivial to pair the survey data with a household that can be seen in the satellite imagery. Some GPS coordinates couldn’t easily be associated with a structure (they were far away from all visible buildings), while others were close to more than one building, resulting in uncertainty around which building the data should be paired with. We addressed this by removing some observations from the training set, and pairing others with multiple buildings, using an inverse distance weighting scheme.
Neural Network Approach
Next, we built a model to predict whether a certain building was eligible for subsidies.
The first predictive model we tried was a deep learning approach, following industry best-practice and Aquaya’s input on their preferred approach. For this model, we once again used a residual u-net due to its scale invariance and typically high performance in segmentation applications.
The results weren’t promising. The model consistently reported all buildings as ineligible, and we believe a large part of that was its inability to properly deal with a large amount of unlabeled data.
At this point, we normally would have shifted gears and tried a different architecture and approach where we flagged images instead of pixels, but Aquaya was facing an end of year deadline, and we didn’t have confidence that an approach like that would work given the comparatively small dataset (~5000 buildings) compared to other similar applications in image classification.
So, we instead shifted to a feature extraction approach where we hoped to use simple regression models to predict household eligibility.
Feature-Extraction and Machine Learning Classification Model
For this approach, we first extracted six features from the imagery for each household, which were established in close collaboration with our partners at Aquaya:
- Roof color: The subject matter experts at Aquaya felt confident this would be a strong predictor because most structures had either sheet metal or thatched roofs, so a dark roof (i.e. thatched, and therefore less expensive material) may prove to be an indication that the household was eligible for support.
- Ground color: We felt it was likely that homes with concrete pads instead of bare soil around the house may also be a strong predictor.
- Building size: We expected a bimodal distribution here, where eligible homes would either be very small, or very large multi-family structures.
- Distance from road: We expected homes further from a roadway would be more likely to be eligible. Road shapefiles were acquired from Open Street Map and verified against a handful of the images, showing no errors and only missing small footpaths.
- Distance from nearest building: We suspected that homes with multiple structures would be more likely to be ineligible.
- Distance from village center: We suspected the further from the center of town you are, the more likely you are to be eligible for support. “Center of town” was defined as the centroid of all the buildings, though refinements can be made in the future if a marketplace or something similar is detectable in the imagery.
We then fed these features into both logistic regression and random forest models to try and predict household eligibility.
Unfortunately, the logistic regression model settled on predicting nearly all households at the base rate of roughly 65%, meaning the false positive rate was unacceptably high. The random forest had similar results. Upon digging into the data further, we realized that the features we had extracted by and large provided no insight into where splits could be made in the data, as the distribution of values for eligible and ineligible homes were all roughly equivalent.
Learnings
Neither modeling approach was successful. In both cases the models were unable to consistently discern between eligible and ineligible buildings.
While this outcome is disappointing, it isn’t entirely surprising given the content of the satellite imagery data itself. To the human eye, even with expert knowledge of the villages, it’s essentially impossible to see features that are correlated with household income.
This isn’t to say, though, that the project was a failure. Firstly, a struggle Aquaya has when performing these surveys is knowing the population density of each village before making a site visit. The building footprint model will enable them to get a sense of the number of households when planning visits such that resources are allocated appropriately.
Secondly, a major limitation of this project was the amount of data available. We have a single snapshot in time for each household, but there is likely seasonality in the imagery that can provide further insights. Aquaya is already talking about investing more resources to acquire imagery at other times of year.
Lastly, the focus of the project was at the household level. Conversations with Aquaya around other features that may be extracted from the imagery at a community level have spurred ideas and partnerships for other research on their end.
This blog post was written by the following members of DataKind San Francisco: Marina Wyss and Kevin Fries. We’d like to thank Chloé Poulin and Caroline Delaire of Aquaya for their support and collaboration on the project.
Images above provided by Aquaya.
Joining the DataKind Movement
DataKind’s work is possible through the generosity of our volunteers, donors, and corporate sponsors. If you’re moved and can join us in supporting this and our future important work, please become a donor here. Every gift helps DataKind harness the power of data science and AI in the service of humanity.
- Interested in supporting our work? Donate here.
- Interested in sponsoring a project? Partner with us.
- Interested in volunteering with DataKind? Look no further.
- Interested in working at DataKind? Apply now!
- Interested in submitting a project? Go for it!
Quick Links
- Understanding Equity in Local Governments: DataKind San Francisco Partners with the City of San José
- Increasing Data Capacity in the Social Sector: Lessons from DataKind San Francisco’s Launch of DataAdvisory Projects
- Advancing Alcohol Behavior Change with Data Science
- Analyzing Unregistered User Activity to Better Understand Readers
- Bringing Showers to SF, Oakland, & LA’s Homeless Community
- Volunteer Spotlight: Melinda Tellez
- Volunteer Spotlight: Kelsey Meagher