Vision Zero |  United States
Objectives
- Partner with New York, Seattle, New Orleans, and Microsoft to explore how data science can help the Vision Zero movement, which aims to reduce traffic-related deaths and severe injuries to zero
- Help New York City’s Department of Transportation improve traffic safety on its streets by understanding what existing safety interventions are working and where there is potential for improvement so the city can better allocate resources
- Inform Seattle’s Department of Transportation’s Bicycle and Pedestrian Safety Analysis to provide policy makers and engineers with actionable information to best allocate funding for future safety interventions and to find out what factors may contribute to crashes–such as traffic volume, street characteristics and environmental variables
- Help the City of New Orleans’ Office of Performance Accountability understand how effective street treatments, like bike lanes, traffic signage and other interventions, are at preventing traffic injuries and fatalities to inform future efforts
Findings
- Developed an innovative model for New York and Seattle that estimates “exposure,” or vehicular volume, enabling both cities, for the first time ever, to accurately estimate the number of motor vehicles on individual streets citywide
- Created a crash model for New York allowing the city to examine individual locations and test how different street characteristics impact the number of injuries.
- Developed models for Seattle to uncover collision patterns involving pedestrians or bicyclists by determining the extent to which roadway user behavior and street design are contributing factors in crashes as well as how such factors relate to the severity of crashes
- Developed an Impact Assessment tool for New Orleans testing the significance of installed treatments, such as bike lanes and traffic signage, to determine their effectiveness and better inform the placement of future street treatments
Question
Tens of thousands of people are killed or injured in traffic collisions each year. To improve road safety and combat life-threatening crashes, over 25 U.S. cities have adopted Vision Zero, an initiative born in Sweden in the 1990’s that aims to reduce traffic-related deaths and serious injuries to zero. Vision Zero is built upon the belief that crashes are predictable and preventable, though determining what kind of engineering, enforcement and educational interventions are effective can be difficult and costly for cities with limited resources.
While many cities have access to data about where and why serious crashes occur to help pinpoint streets and intersections that are trouble spots, the use of predictive algorithms and advanced statistical methods to determine the effectiveness of different safety initiatives is less widespread. Seeing the potential for data and technology to advance the Vision Zero movement in the U.S., DataKind and Microsoft wondered: How might we support cities to apply data science to reduce traffic fatalities and injuries to zero?
What Happened
Three U.S. cities – New York, Seattle and New Orleans – partnered with DataKind, in the first and largest multi-city, data-driven collaboration of its kind, to support Vision Zero efforts within the U.S. Each city had specific questions that they wished to address related to better understanding the factors contributing to crashes and what types of engineering treatments or enforcement interventions may be most effective in helping each of their local efforts and increase traffic safety for all.
To help the cities answer these questions, DataKind launched its first ever Labs project, led by DataKind data scientists Erin Akred, Michael Dowd, Jackie Weiser and Sina Kashuk. A DataDive was held in Seattle to help support the project. Dozens of volunteers participated in the event and helped fuel the work that was achieved, including volunteers from Microsoft and the University of Washington’s E-Science Institute, as well as many other Seattle data scientists.
The DataKind team also worked closely with local city officials and transportation experts to gain valuable insight and feedback on the project, and access a wide variety of datasets, such as information on past crashes, roadway attributes (e.g. lanes, traffic signals, and sidewalks), land use, demographic data, commuting patterns, parking violations, and existing safety intervention placements.
The cities provided information about their priority issues, expertise on their local environments, access to their data, and feedback on the models and analytic insights. Microsoft enabled the overall collaboration by providing resources, including expertise in support of the collaborative model, technical approaches, and project goals.
Below are detailed descriptions of the specific local traffic safety questions each city asked, the data science approach and outputs the DataKind team developed, and the outcomes and impacts these analyses are providing each city.
New York: Estimating Street Volumes and Understanding How Street Design Can Reduce Injuries
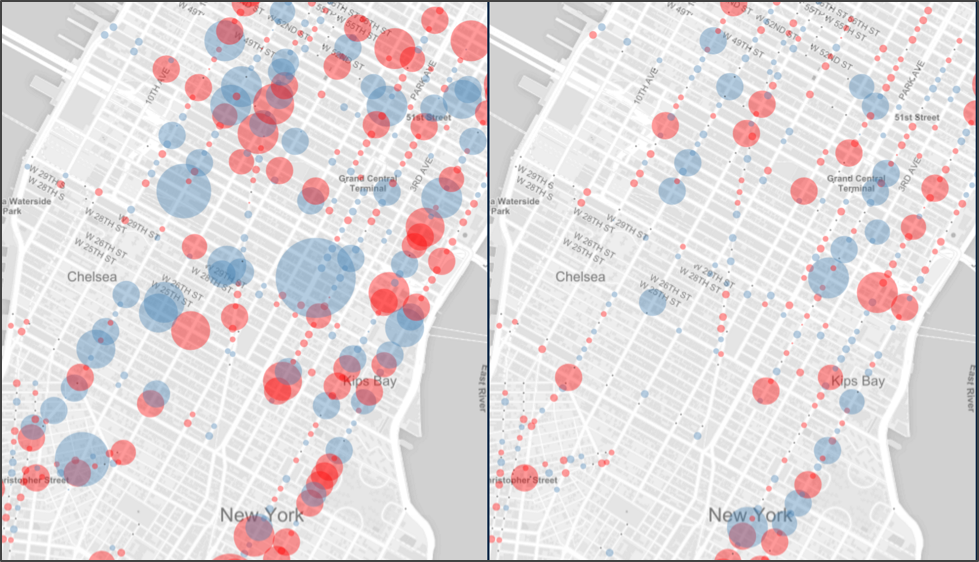
Map showing street improvement projects locations and change in crashes in New York.
According to the City of New York, on average, vehicles seriously injure or kill a New Yorker every two hours, with vehicle collisions being the leading cause of injury-related death for children under 14 and the second leading cause for seniors. Looking to improve traffic safety on its streets, the city wanted to understand what existing interventions are working and where there is potential for improvement to help inform how the city can better allocate its resources to protect its residents.
Approach
The team leveraged datasets from New York City’s Department of Transportation, NYC OpenData, New York State, as well as other internal city data, to examine the effectiveness of various street treatments to help inform the city’s future planning and investment of resources. Lacking some of the data necessary to address the actual impact of existing street treatments, the team looked to answer other crucial questions regarding traffic safety that could help benefit the city.
Before they could answer these questions, they first needed to answer a more basic one – how many cars are on the road? Knowing the total volume of road users or “exposure” is necessary to understand the true rate of crashes, but most cities don’t have this data available. To overcome this, the team designed an innovative exposure model that can accurately estimate traffic volume in streets throughout the city. The model has two main components. The first is an algorithm that propagates traffic counts on a single street segment to adjacent street segments. It assumes that traffic on one city block is very similar to traffic on adjacent blocks. This process can be run many times and allows one to widely propagate traffic count values along neighboring streets. However, some streets may not have any nearby traffic counts available, so the second component of the model is a machine learning model, with high predictive accuracy, that predicts traffic volumes on streets based on their characteristics.
The team also created a crash model for New York, allowing the city to examine individual locations and test how different street characteristics impacts the number of injuries. For example, the city may be able to look at a particular street and determine whether it is safer for the street to be a one- or two-way road.
Outcomes
The exposure model will prove to be invaluable to the City of New York, filling a crucial void in vehicle volume data that many cities face. With it, the city can now perform initial safety project feasibility studies very quickly and provide context for a variety of other safety research work that requires an “exposure” rate. The model can also be altered to estimate other defined traffic volume measures, like peak hour traffic volumes. It can also help inform future work related to traffic congestion and citywide vehicle usage.
New York can also use the crash models to test the potential impact different engineering, land use and traffic scenarios would have on total injuries and fatalities in the city. They will continue to build upon the work started by DataKind, as the models developed set the stage for future research in crash prediction, congestion relief and city safety projects.
“DataKind delivered a safety planning tool to us that has long seemed unattainable – a reliable estimator of traffic volume on every street in New York City,” said Rob Viola, Director, Safety Policy & Research at New York City Department of Transportation. “In addition, their crash injury estimation model will be integral to answering some of the thorniest questions that the agency encounters, such as what would be the safety effects of road pricing? What categories of streets are best served by specific safety treatments? Why are their low crash places along high crash corridors?”
The team was able to leverage the work started in New York City to help develop and refine the approaches for both Seattle and New Orleans.
Seattle: Understanding How Street Design, Driver Behavior and the Surrounding Environment Contribute to Crashes

This “exposure” model developed for New York and Seattle shows estimates of citywide traffic volume, a key piece of information needed for advanced analyses that most cities don’t have.
While Seattle has seen a 30 percent decline in traffic fatalities over the last decade, traffic collisions are still a leading cause of death for Seattle residents age 5-24. Older adults are also disproportionately affected, so this trend could grow as the population ages. To supplement the findings of the City’s Bicycle and Pedestrian Safety Analysis project and provide policy makers and engineers with actionable information for developing and implementing interventions, Seattle sought to find out what mid-block street designs are most correlative with collisions involving vulnerable roadway users and what the probability of such collisions occurring is at identified locations.
Approach
Using Seattle’s collision, roadway traffic, exposure data and environment characteristics, the DataKind team developed models to uncover collision patterns involving pedestrians or bicyclists and determined the extent to which contributing circumstance and street design are correlated with collision rates, as well as the severity level of specific types of crashes. The team also applied the methodology developed for their work with New York to calculate exposure or total traffic volume citywide for Seattle.
By incorporating incident-specific information such as time of day, weather, lighting conditions and behavioral aspects, the team was also able to further develop a crash model to evaluate elements that may contribute to crashes at intersections and to what extent driver behavior, road conditions and street design played a role.
Outcomes
The DataKind team was able to determine several variables that had the greatest impact on midblock collisions – traffic volume, land use, number of traffic lanes, street width, and pedestrian concentration were the most demonstrative inputs associated with collisions.
For instance, it was found that the fact of whether a motor vehicle is making a right turn or left turn at a given intersection will influence the severity of the collision. Researchers were also able to identify in which months of the year incidences of crashes appeared to be better or worse. Interestingly, the number of crosswalks was found to be significant and that more crosswalks at an intersection showed reduction in the severity of crashes.
With these insights, Seattle will be able to pinpoint high risk areas and the factors that can be addressed to help reduce future crashes. The city recently passed a levy to fund multi-modal transportation improvements city-wide and the results from this project along with additional safety studies, will help guide more than $300 million in Vision Zero investments over the next nine years.
“As a result of this partnership, we have a better understanding of some of the most common safety issues, and where and how we need to focus our efforts for making our streets safer for all users,” said Scott Kubly, director of the Seattle Department of Transportation.
New Orleans: Evaluating the Effectiveness of Street Treatments

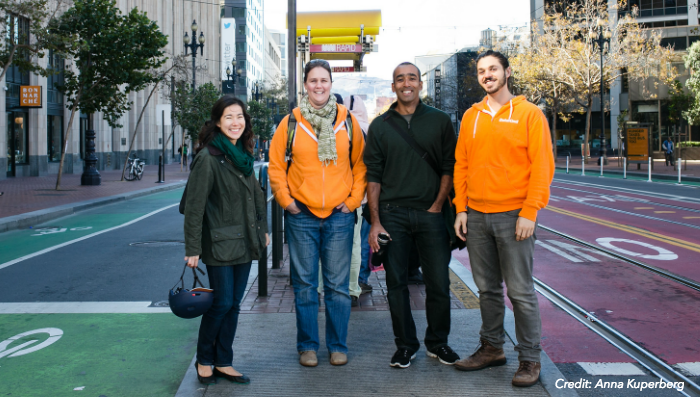
Photo by Anna Kuperberg
While New Orleans hasn’t officially adopted Vision Zero, the city government and community are working together to make roads safer. In 2014, New Orleans was named a “silver” level bicycle friendly community by the League of American Bicyclists and had the 8th highest share of bicycle commuters among major U.S. cities. New Orleans also leads Southern U.S. cities in bicycle commuting. Yet, a disproportionately high number of the state’s pedestrian crashes occur in New Orleans and the number of bicycle crashes doubled from 2010 to 2014.
To help the city protect its growing number of roadways users, New Orleans wanted to understand the impact that future installation of street treatments, such as bike lanes and traffic signage, could have on preventing traffic injuries and fatalities.
Approach
The DataKind team created an Impact Assessment tool that could be used to test the effectiveness of installed treatments, which would then be used to better inform the placement of future street treatments, both individual interventions and groups of interventions applied simultaneously.
Specifically, the tool takes a set of treatment locations and uses different statistical methods to create sets of comparison locations. These comparison locations are used as a point of reference to gauge the impact of the treatment on traffic safety by comparing crash rates before and after the installation of interventions to similar intersections that did not receive interventions. The tool includes visualizations to examine generated comparison groups, as well as methods for using manually selected comparison groups.
As an example, New Orleans could select a treatment, such as a bike lane, and compare the crash rates before and after the bike lane was installed. The city can then compare these crash rates to other comparison sites. The comparison sites are especially important because they allow the city to prepare for outside factors, such as overall growth in population or traffic. The crash rate could actually increase at a treatment site but this may be due to other factors such as large increases in traffic. When comparing a treatment site with similar untreated sites, we can see if the crash rate increased at a lower rate, thus indicating an improvement in safety due to the treatment.
Outcomes
New Orleans has integrated the Impact Assessment tool into their systems and will be collecting more data to maximize the tool’s potential and evaluate the effectiveness of additional street features. These findings will help inform the placement of future street treatments.
“Making streets safer for all New Orleanians is a major priority of ours,” said Oliver Wise, director for the City of New Orleans’ Office of Performance and Accountability. “With the tool that DataKind developed for us, we will be able to provide our transportation policy leaders actionable intelligence on what traffic safety investments are most effective in reducing crashes. We are grateful for their investment in the people of New Orleans.”
Next Steps
Overall, the work accomplished by the Vision Zero Labs team proved to be invaluable for the cities of New York, Seattle and New Orleans, equipping them with powerful insights, models and tools that can help inform future planning to prevent severe traffic collisions and keep all road users safe. With this knowledge, the cities can better determine how to best allocate resources and investments towards improvements in infrastructure and policy changes.
In addition to aiding the participating cities in their efforts to make streets safer, the project showed how data science can be effectively used to address complex civic issues like transportation safety. A particular example is the technique developed in this project around estimating road use volume even when complete data is lacking. This technique is relevant both for safety analyses and broader transportation planning activities. These are the kinds of cutting edge and scalable solutions DataKind’s Labs projects aim to deliver to achieve sector wide impact.
The project also showed how collaboration between the public and private sector and amongst partner organizations can help benefit the greater good and result in innovative and scalable solutions to address complex and critical issues like traffic safety. Cities around the world will be able to benefit from the results of the Vision Zero Labs project and can adopt the methodologies and learnings from the work to reduce traffic-related injuries and fatalities in their own communities.
Learn More
- Interested in replicating this work in your own city? Check out our Labs Blueprint.
- Read more about the power of data and collaboration to improve traffic safety on our blog.
- Check out this blog from Elizabeth Grossman, Director of Civic Projects for Microsoft’s Technology and Civic Engagement group.
- Check out Microsoft’s case study on this work.
- Learn more about the project and its beginnings.
- Learn more about New York’s commitment to Vision Zero.
- Learn more about Seattle’s commitment to Vision Zero.
- Learn more about the Vision Zero Network.
- Read the press release about this project.