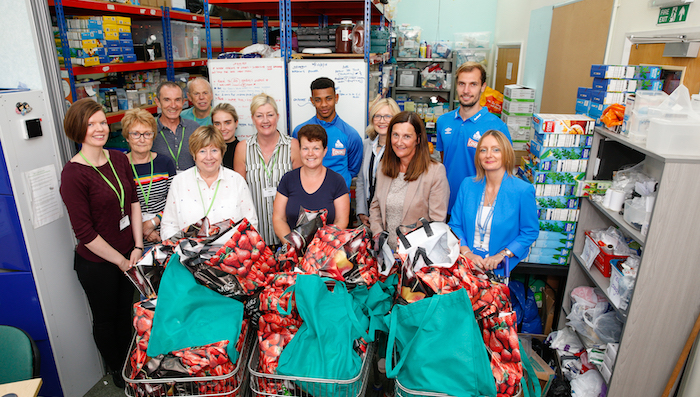
The Welcome Centre |  Huddersfield, UK
Objectives
- Build a machine learning model to predict which of The Welcome Centre’s clients are likely to become dependent on the food bank’s food and other packs
- Deploy the machine learning model within The Welcome Centre’s existing system and flag those who are mostly likely to become dependent, enabling them to be prioritised for additional support from the food bank’s support work
Findings
Question
The Welcome Centre (TWC) is a food bank based in Huddersfield, UK. They provide support to people in crisis, offering practical help in the form of food, toiletry, and household support packs. A support worker provides advice to those using the service to help address the underlying problems, and help them avoid becoming dependent on the food bank.
TWC has seen the number of people dependent on their packs grow over time, but identifying those most in need of support (who are most likely to become dependent) is challenging. Currently, such clients are identified manually by the support worker, based on the frequency and number of their referrals.
DataKind UK and TWC partnered to build a system that could identify a client’s likelihood of needing additional or longer term support and to work jointly to implement this process. The aim was to create a probability score which could aid the support worker to decide, in conjunction with other information, whether a client is likely to need extra support. This would enable TWC to improve the accuracy and efficiency of the targeted work that the support worker undertakes, and make an earlier intervention before a crisis escalates.

Process to enable early intervention for people likely to be in need of additional support.
What Happened
Four DataKind UK volunteer data scientists (James Gin, Clare Kitching, Lucy Rimmington, and David Sykes) worked with staff and trustees at TWC to build a machine learning model to estimate the likelihood of food bank clients becoming dependent on the food
bank’s packs and integrate this model into TWC’s existing system of flagging high-use clients to TWC’s support worker.
Defining dependency
To be able to predict which clients are likely to become dependent, we first needed to define what we mean by “dependent”. There wasn’t a clear definition, but there were views around dependency; some staff and volunteers thought that more referrals to TWC for packs indicated higher dependency, whereas longer gaps between referrals show an indication of a client being able to “get back on their feet” and therefore lower dependency. However, if we only consider the number of referrals, we exclude crucial information around the frequency or recovery periods.
Our approach was to take information on both the referral numbers and time between referrals over the past 12 months of a client. We created our dependency score as:
Dependency Score = (Number of Referrals to TWC in next 12 months – Number of Gaps) / 52
This results in a dependency score between 0 and 1, with 1 indicating referrals for all 52 weeks in the year.
Building and testing the model
There was data available for the past three years of TWC activity. This data covered a client’s historic pattern of referrals, the issues that the client faces, the specific reasons for being referred to TWC each time, and personal characteristics.
The statistical model that was used to predict dependency is a predictive algorithm known as a random forest. This is a common method used by data scientists working with large structured datasets. The advantages of this algorithm are its high predictive power and the ability to find non-linear relationships between our target variable (dependency) and explanatory variables (e.g. referral issue or time since last referral). The disadvantages of this model are that it can be too specific to information that it has seen before (and not be a good predictor of new behaviour), and has a limited ability to understand the nature of the relationships between variables in the model.
The team chose this algorithm as it provided the best performance on a test set. Linear Ridge regression models were also tested as an approach to understanding the relationship, however, these models didn’t perform as well.
Interpreting the model
The model produces a predicted dependency score between 0 and 100. This score doesn’t by itself show the whole picture as to whether a client is more likely to become dependent. What can provide more insight into a client’s behaviour is whether their current trend of referrals make it more likely that they’re becoming dependent.
To understand a client’s trend, we can use both the historical score and the predicted score. Every time a client is referred, the historical dependency score is calculated. For example, if this is the client’s first referral they would get a historical score of (1/52)*100 = 1.9. This historical dependency score is combined with the predicted dependency score to give a ratio:
Score Ratio = Predicted Score / Historical Score
This effectively measures how we expect a client’s usage of TWC to increase or decrease over time. A Score Ratio of 2.0 means we expect the client to come back twice as many times as they came before. This ratio is designed to avoid the system only referring heavy users to the support worker (TWC would likely have already seen them many times before), but instead identify users whose needs might be increasing, and who therefore may benefit from support.
Deploying the model
In implementing the model within TWC’s existing systems there were two main areas of decision making. One was where to run the model (server, etc.) and the other was how to integrate the model’s score ratio with TWC’s system of flagging for referral to the support worker and ensuring that support resources could be effectively managed.
On the first question, we used serverless architecture in the form of AWS Lambda, which has recently come onto the market. Amazon now takes care of provisioning and scaling the servers that run the code, which means no server administration is needed. AWS Lambda is also low cost; the typical cost of running a server 24/7 for a year is approximately $400, while the cost for Lambda Functions is $32.
On the question of integrating with TWC’s flagging system, we used thresholding. If the Score Ratio is over the set threshold, the client is flagged for referral to the support worker. The threshold has been calibrated to achieve a 10% support worker referral. This can be easily adjusted over time by TWC to allow for changes in line with resource management and changes in TWC operations. At DataKind UK, we’ll work with TWC to evaluate the performance of the model over time.
For further details on the coding used within this project, see our Github repository.
Next Steps
The model was tested in the development phase and was tested during a live trial within TWC’s system. This enabled us to ensure that the model was working as it should. Now that the model is fully operational, it will be important to ask the higher level question of whether the model helps TWC to achieve its ultimate objective of identifying those who are most likely to become dependent and to reduce their dependency issue.
The model has significant potential to be replicated by other food banks, as well as in other settings where a similar problem of dependency or high usage exists. The Welcome Centre and DataKind UK are sharing insights and lessons learned in order to facilitate this knowledge sharing and replication. If you’re interested in hearing more, or attending our workshops for social change organisations, please contact us.
Supporting early intervention work: Case study from The Welcome Centre