By DataKind San Francisco
Background
Access to clean water, sanitation, and hygiene (WASH) is critical for healthy and humane living conditions. Two billion people lack access to safely managed drinking water at home, according to the CDC. Access to safe drinking water and sanitation services can have life or death consequences. In 2016, unsafe drinking water and inadequate sanitation contributed to 829,000 deaths, accounting for 60% of total diarrheal deaths.
Increasing access to safe drinking water, adequate sanitation, and hygiene also creates spillover effects in the quality of life, with greater school attendance, fewer sick days, and increased sense of safety and dignity. However, in remote or rural areas, it’s challenging to access high quality data to better target people most in need and to make rigorous decisions.
Aquaya, a data-driven nonprofit organization operating in 24 countries around the world, was founded to help overcome these challenges by combining data collection, advanced analytics, and research to help make informed WASH program, policy, and financing decisions.
DataKind San Francisco was privileged to work with Aquaya throughout 2022, initially on a DataCorps® project analyzing satellite imagery, and more recently on a Data Advisory project described below to incorporate cloud-based storage and machine learning models to predict water well quality in remote regions of Uganda.
Data Advisory Project Execution
For this project, Aquaya aimed to build machine learning models that predicted the groundwater quality from wells in Uganda. Historical measurements of E. coli levels in wells (which is an indicator of fecal contamination in water) were available from various organizations including Water and Health for All, Whave, Water Mission, Charity Water, BGS and Aquaya. These measurements were obtained at the daily level sporadically from 2010 – 2022 and provided a categorical assessment of E. coli levels. In addition, data was extracted from satellite imagery pertaining to the areas surrounding each well to acquire a feature set to help train machine learning models.
At a high level, this project involved (1) identifying and consolidating all datasets containing relevant features and predictors (2) setting up AWS tools including S3 and SageMaker and (3) performing modeling techniques on the training data to predict the well groundwater quality.
Data Preparation Using AWS tools
Our first initiative was to assist the Aquaya team in consolidating all datasets with relevant features and predictors. Aquaya had around 27 GB of heterogeneous data stored in an external hard drive including CDF, TIFF, CSV, and TXT file formats. Our team helped extract the well groundwater quality data as well as other parameters such as the presence of livestock, poverty levels, population density, and land cover characteristics around the well. This was combined with latitude, longitude, temperature, and precipitation information for each measurement where possible.
Next, we uploaded all the relevant data into Amazon Web Services’s S3 cloud storage service to help Aquaya utilize the latest cloud technologies to meet their workload while operating at the lowest possible cost.
We then set up a Sagemaker notebook instance with Jupyter notebooks using a combination of R and Python programming languages, to leverage AWS’s in-built machine learning pipeline infrastructure. We helped the team setup AWS Notebook instances in R as they were more cost effective than SageMaker R Studio.
After preparing the data, we leveraged Amazon’s Sagemaker Autopilot feature which makes machine learning classification and regression analysis easy to deploy from tabular data stored in S3. Through this final step, the team was able to quickly segment the data into train and test splits (taking into account splitting by chronological timestamps), evaluate performance of multiple models, and fine tune parameters to select the top performing model.
Cleaning and Exploring the Data
The first step in cleaning and exploring the data was to consolidate data across various file formats into one unified csv and then drop or impute any missing values of key variables. The predictor variable (well groundwater quality) was available at the daily level per well for ~10 years historically. Days with missing values for water quality were removed, as well as features for which a majority of the data was missing.
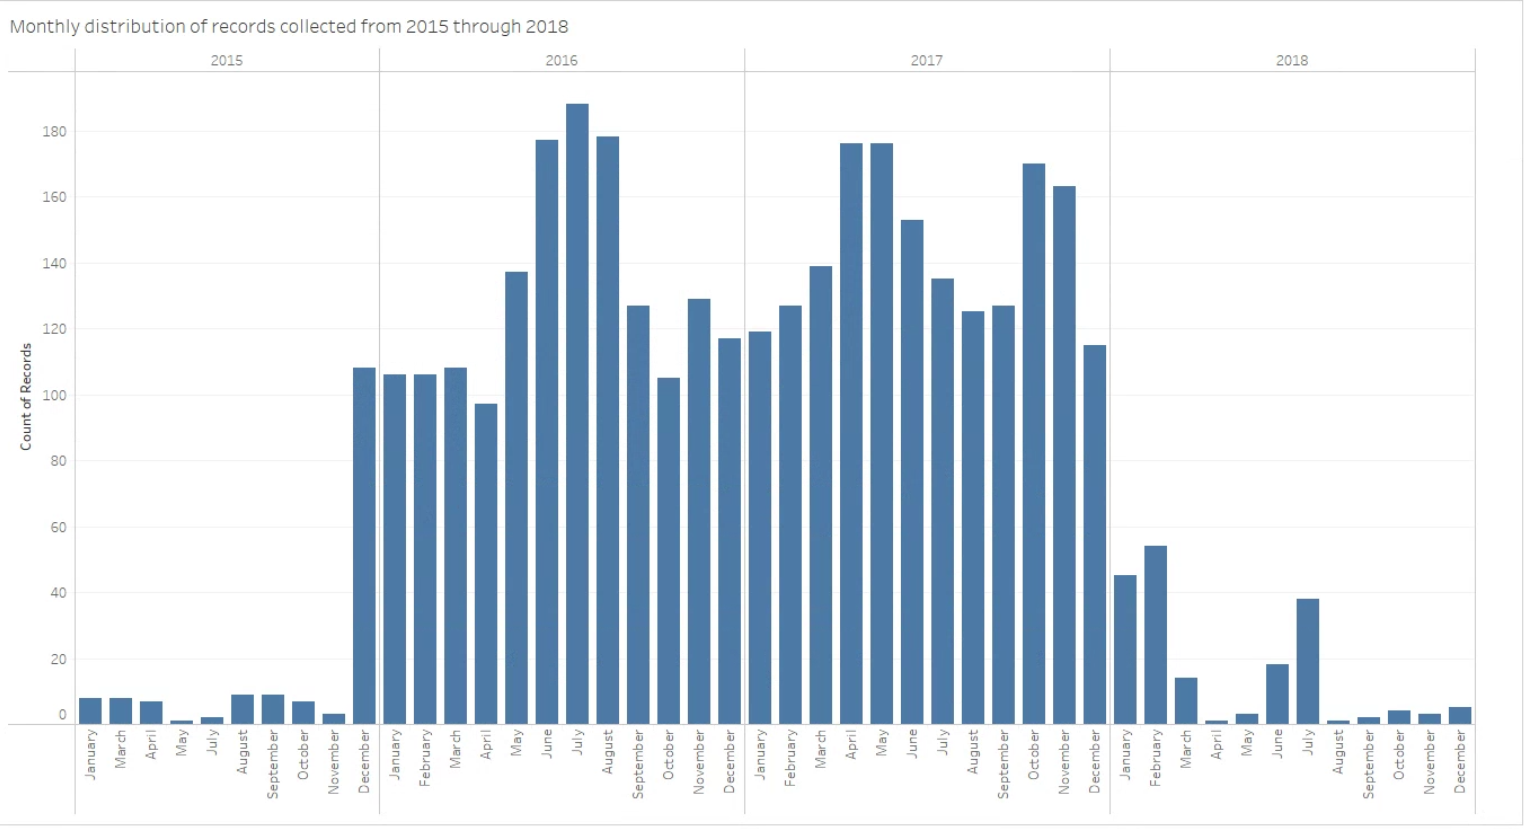
Figure 1: Number of records available over time. The figure above depicts the number of aggregated well-days per month where well groundwater quality data was available. Most high quality data was collected between 2015 and 2018.
We used several exploratory techniques to better understand how our features related to the outcome of interest, ground water quality. A correlation matrix helped show which features had the highest correlation with well groundwater quality, as well as identified collinear features; see visualization below. Of particular interest, some of the features that had the highest correlation were region and daily precipitation. Also, many features were correlated with each other, such as the livestock-related features, suggesting some feature reduction was necessary.
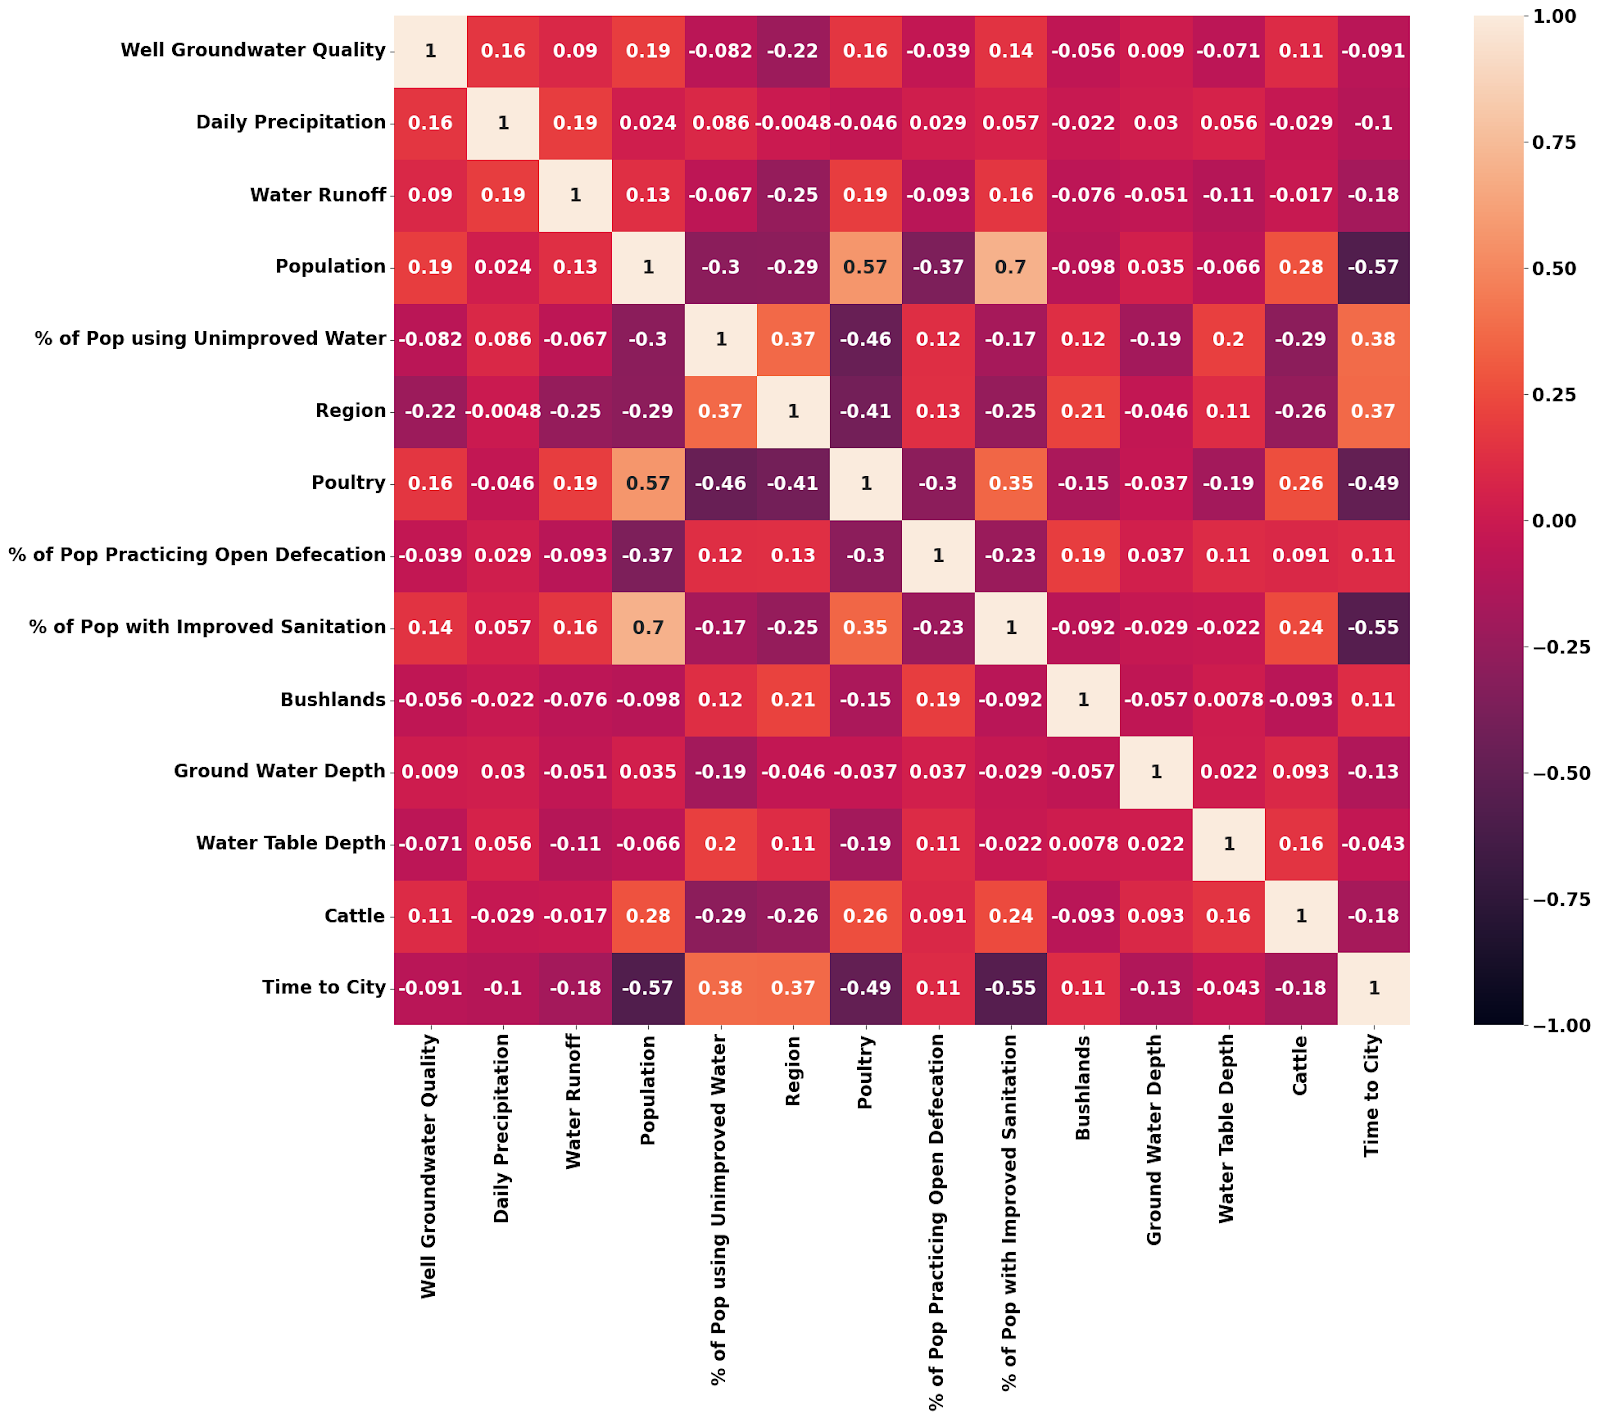
Figure 2: Correlation Matrix Results. The visualization above depicts the correlation matrix between well groundwater quality and some selected features.
Feature Engineering and Model Building
Using the results of our correlation matrix, we combined similar features to eliminate redundancy. For instance, the original dataset had three separate variables indicating the volume of livestock poultry within 5000, 2000, and 1000 kilometers of the well. All three of these variables were found to have similar impact on water quality so we kept the one with the highest Pearson coefficient.
Similar methods were used for other features such as grass-land coverage around the well, with separate variables originally present for varied radii. In these scenarios, the team kept the land cover features with the highest pearson coefficient with the predictive outcome.
The goal of this project was to determine if ground water extracted from wells is safe for drinking or not according to WHO standards, hence we changed the multiclass output (originally scored as 0-clean,1-acceptable and 2,3- not potable water) to a binary variable with 0 for safe water and 1 for non safe water.
Listed below are the models we built using libraries such as PyCaret, SciKit-Learn, and SageMaker Studio AutoML. For all these libraries, we leveraged cloud-based tools like AWS and Google Co-Lab for seamless analytical service for Aquaya.
| Library | Model Name | Accuracy | Precision | Recall | F1 Score |
| SageMaker Studio | Weighted Ensemble (Auto ML) | 0.79 | 0.82 | 0.74 | 0.78 |
| SciKit-Learn | Histogram based Gradient Boosting Classifier | 0.75 | 0.72 | 0.77 | 0.74 |
| PyCaret | Extra Trees Classifier | 0.72 | 0.69 | 0.82 | 0.75 |
| PyCaret | Random Forest Classifier | 0.69 | 0.64 | 0.91 | 0.75 |
| PyCaret | K Neighbors Classifier | 0.69 | 0.69 | 0.69 | 0.69 |
| PyCaret | Logistic Regression | 0.66 | 0.63 | 0.83 | 0.72 |
Figure 3: Model Performance Table
In the end, we selected the weighted ensemble model from AWS Auto ML due to the highest observed precision. We chose to optimize for precision as we wanted to minimize the number of predicted false positives (i.e. where groundwater quality is predicted as safe when in reality it isn’t). We were less concerned with recall for this application, as false negatives are acceptable (i.e. predicting water quality as not potable when it actually is potable is a safe choice).
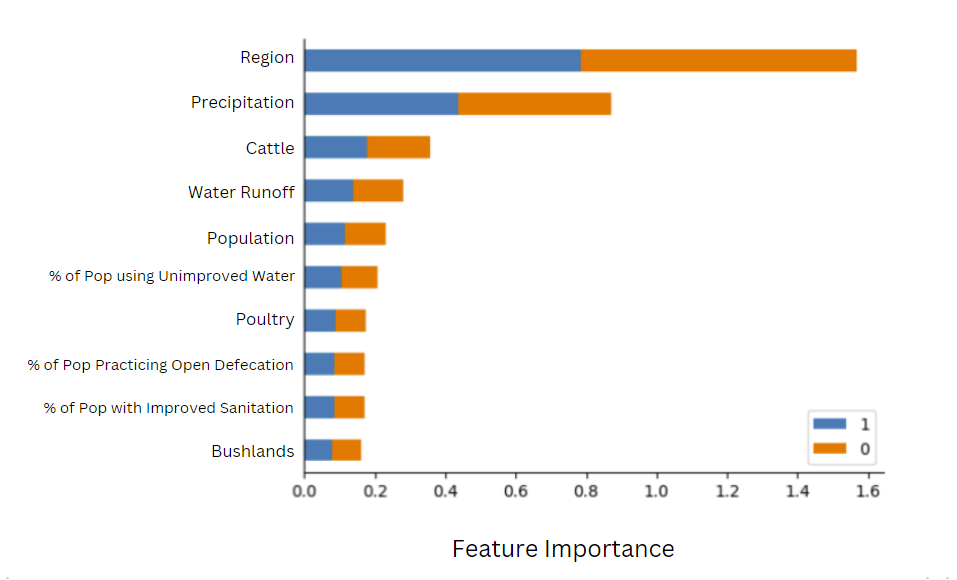
Figure 4: Feature Importance graph. The visualization above depicts the top predictive features in our winning model (weighted ensemble).
Looking Ahead: Next Steps
While a final model with impressive scoring metrics was built during the course of this project, the team had a few thoughts for follow up work to further improve model performance and aid the dissemination of knowledge across Aquaya.
One direction to improve the model is to bin many of the high variability quantitative variables into 15-20 different bins per variable. In total, of the 35 input features, many have high variability. In the relatively small dataset we are working with, such high variability can introduce noise and outliers which is more likely to influence model results. Binning quantitative variables could improve model scores and additionally make the model easier to interpret.
Another idea to improve the model is to build a model specific to each region in Uganda. As observed from the feature importance graph in the previous section, the most important feature for model training was the region of the well. This suggests there is potentially high variability in the amount (refer to Figure 5) and type of data collected in each region. By building models specific to each region, we can remove this region-associated variability, and optimize model parameters to relevant groupings of wells. However, it’s also possible that this may lead to overfitting as the sample size that each model is trained on is reduced.
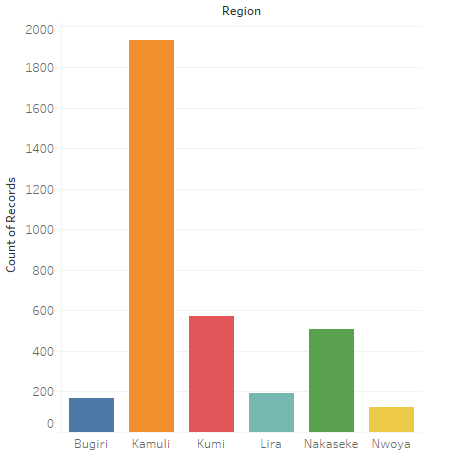
Figure 5: Distribution of Data collected from Regions
Finally, in order to improve dissemination of knowledge more extensively across Aquaya, a next step would be to create an interactive visual dashboard that maps well locations and predicted water quality across Uganda. This would enable internal members of the organization to understand historic trends of well groundwater quality as well as future trends. In the long term, this could help to influence where Aquaya resources should be allocated based on areas that have the highest need for improvement.
As Data Advisory at DataKind San Francisco grows, we hope to partner with more nonprofits in need of data infrastructure guidance! We hope this project can be a useful framework for future data advisory projects requiring cloud computing. If you or your organization are looking to partner with us, please reach out to sfbayarea@datakind.org to learn more.
The Data Advisory project team and those who co-wrote this blog included:
- Chloé Poulin, Senior Research Manager, Aquaya Institute
- DataKind San Francisco Volunteers: Anjana Sundaram, Jaya Pokuri, Padma Chandramouli
We’d like to also thank Melinda Tellez (DataKind San Francisco) and Melissa DiLoreto (DataKind) for their support and guidance throughout this project.
Header image courtesy of Aquaya.
Join the DataKind movement.
- Interested in supporting our work? Donate here.
- Interested in sponsoring a project? Partner with us.
- Interested in volunteering with DataKind? Look no further.
- Interested in working at DataKind? We’re hiring!
- Interested in submitting a project? Go for it!