By DataKind DC
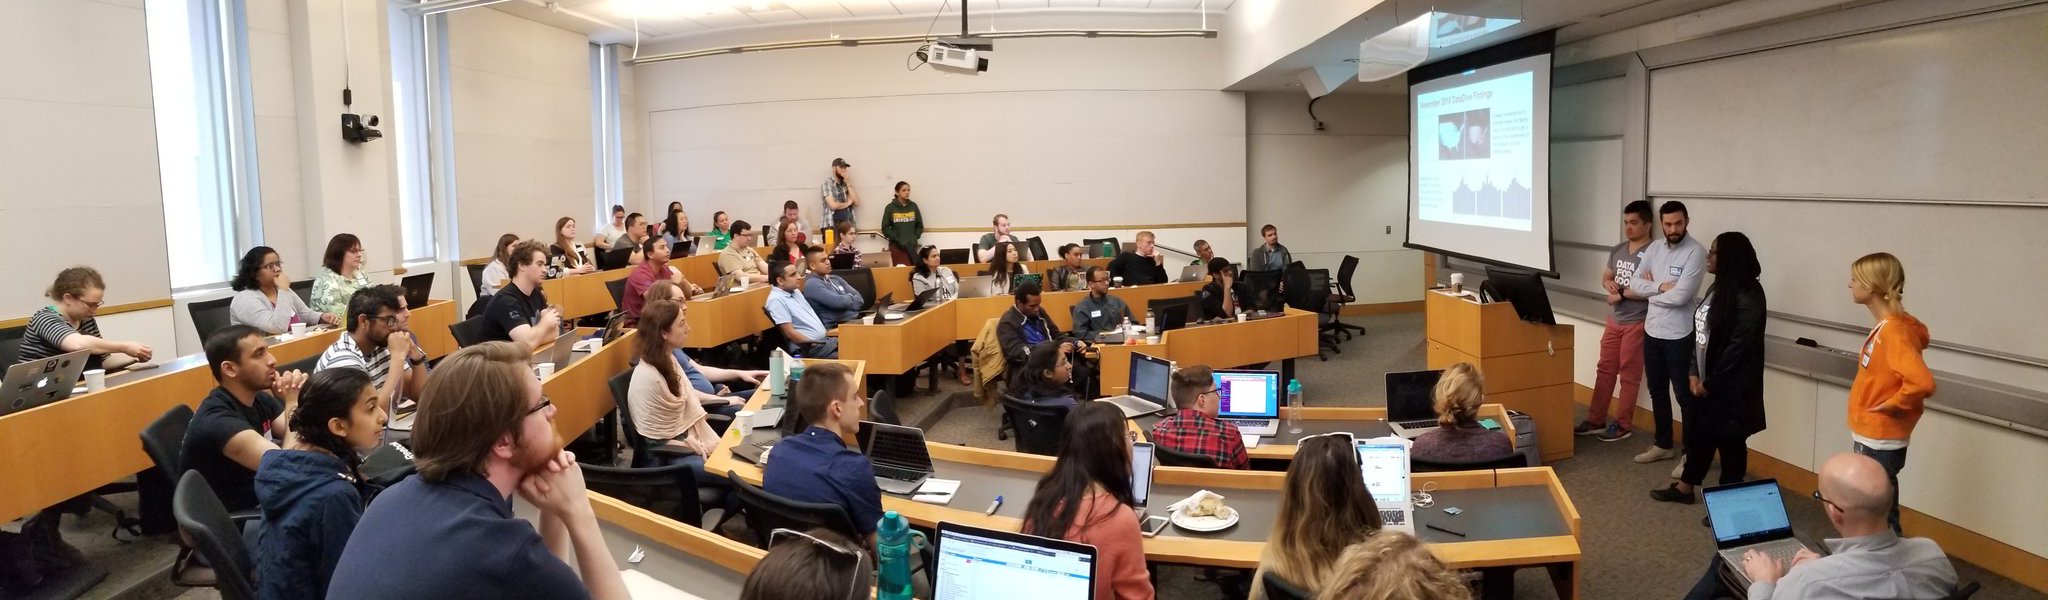
DataKind DC held its first citizen science DataDive last month (April 27-28, 2019). Citizen science is the public contributing to the scientific process, usually by helping with data collection. More than 50 data scientists showed up over the weekend to help organizations collate, visualize, and analyze data gathered by citizen scientists from around the world to help advance the missions of several nonprofit organizations. Participating organizations included the National Audubon Society, Chesapeake Monitoring Cooperative, OpenAQ, National Geographic Society, Earth Challenge 2020, and American Red Cross. Check out highlights from the weekend and learn about how you can get involved with DataKind DC below!
National Audubon Society
The National Audubon Society, a nonprofit that protects birds and the places they need today and tomorrow, began the annual Christmas Bird Count in 1900. This bird census is one of the first examples of citizen science. Every year, volunteers from around the world gather to count birds. The long-term perspective of the census provides vital information for bird conservation efforts. DataDive volunteers visualized changes in the number and location of bird count volunteers over time. This information will be useful for the Audubon Society to understand attendance trends and plan for the future. It also might help motivate folks in underrepresented areas to join the count!

Chesapeake Monitoring Cooperative
Across the 64,000 square miles of the Chesapeake Bay watershed, volunteer community members are visiting their local streams and rivers to make observations about the physical, chemical, and biological features of the water. Their observations of water temperature, salt concentration, bacterial abundance, and other properties supplement data collected by government agencies, which helps to fill in gaps in our understanding of where in the watershed the most significant pollution sources are and how they can be mitigated. The Chesapeake Monitoring Cooperative (CMC) manages this citizen science data collection effort, and has developed a structured data entry system that has allowed them to construct a large dataset derived from 29 different local organizations. DataDive volunteers built a prototype of an advanced data visualization tool that will allow the CMC’s stakeholders to easily query and visualize the spatial extent of observations for specific data types and recent trends in the data. This tool will provide a powerful platform for identifying data gaps and priority streams, which will help them direct their existing resources and support future funding proposals.

The prototype above is a data visualization tool for CMC. The orange points represent sites with E. coli data and light blue points represent sites without E. coli data.

Users can also see recent data trends for selected parameters at individual sites.
OpenAQ
Air pollution is one of the leading public health issues of our time, however, it’s solvable. From Ulaanbaatar, Mongolia to Beijing, China, to Los Angeles, USA, open data has helped communities generate sustained political will to fight the problem. OpenAQ helps communities fight air inequality by harmonizing and making more fully open existing disparate air quality data. Now that OpenAQ has gathered 400+ million data points from 70 countries over the past few years, they need help in giving policy decision-makers, public health scientists, and others easier access to historical, city-level trends in the data.
DataDive volunteers delivered new insights into historical air quality data, such as how countries rank in worst air pollution (see figure below), specifically by the particulate matter metric pm2.5, and how by this same metric air pollution is worsening globally over time. OpenAQ partners are continuing this work through better tools and visualizations for delivering historical city averages over different spans of time. Learn more from OpenAQ founder, Chris Hasenkopf, and review her Twitter thread on this work.

National Geographic Society
National Geographic Society, a global nonprofit committed to exploring and protecting our planet, wants to showcase the power and return on investment of data-driven decision-making in global conservation organization’s investment planning and program impact assessments. The initial focus is on the categorization of remote wilderness areas. At the DataDive, DataKind volunteers focused on building the foundation for future model creation and analyses. DataKind volunteers tackled work from two perspectives: categorizing “typical” normalized difference vegetation index (NDVI) values and building a training data set. The “typical” NDVI categorization focused on grasslands and wetlands in Africa’s Zambezi strip. This area is an important ecosystem in the Angola, Botswana, Zambia, and Namibia regions and its protected areas are at risk of encroachment from domesticated grazing herds and farming.
An example NDVI curve is shown below.

The second effort focused on building a training data set. A practice in the Ghanzi, Botswana region is to move herds of animals between watering holes. We identified a spoke pattern of roads and paths between the watering holes. The team searched through satellite imagery to draw bounding boxes around the spoke patterns.
Examples of the spoke pattern and bounding boxes are shown below.


DataDive volunteers will continue to build out the NDVI curves and training data set. With the NDVI curve data, the volunteers will build an anomaly detection system to enable the identification and monitoring of areas that have converted from one land cover type to another, via, e.g., grazing from domesticated animals. With a complete training data set, the team plans to create a watering hole classification model to look at location and changes of the watering holes over time.
Earth Challenge 2020
April 22, 2020 marks the 50th anniversary of Earth Day. In recognition of this milestone, the Wilson Center, Earth Day Network, and U.S. Department of State are leading Earth Challenge 2020, a global activation experience to advance the use of citizen science for environmental and human health. Earth Challenge 2020 seeks to engage millions of people in collecting, cataloguing, and integrating one billion interoperable, high quality data points in an API-enabled platform. To inform this data collection, the goal for the DataDive was to analyze existing citizen science datasets to understand the extent to which they can be harmonized and used to address Earth Challenge 2020’s research questions. We focused on the following research question: What is the extent of plastics pollution?
DataDive volunteers worked to clean, integrate, and visualize openly available citizen science datasets on plastics pollution from Adventure Scientists Global Microplastics Initiative, The National Oceanic and Atmospheric Administration’s Marine Debris Monitoring and Assessment Project, The Ocean Conservancy’s TIDES database, and the European Environment Agency’s Marine LitterWatch project. The team used ArcGIS to integrate and visualize the plastic pollution data.
Below is a heat map showing plastics per liter (PPL) in marine water samples collected by the Global Microplastics Initiative.

Below is a visualization that integrates the NOAA’s MDMAP data (orange scale) and the EEA’s Marine LitterWatch data (purple scale). This is the first time these two datasets have been visualized together on one map!

In the process of working through these datasets, DataDive volunteers collected observations and recommendations to inform the Earth Challenge 2020 partners. We reported on the gaps that exist in current citizen science datasets as well as challenges present in harmonizing them. These observations will help the partners develop a citizen science app that can be more effectively used to draw conclusions about the Earth Challenge 2020 research questions.
American Red Cross
Through a longstanding collaboration with the American Red Cross (ARC), DataKind volunteers have provided analytical support for ARC’s Home Fire Campaign. A focal point of ARC’s campaign is to reduce home fire deaths and injuries through in-home visits where volunteers and community partners provide fire safety education and install free smoke alarms. Since the launch of this campaign in October 2014, over 1.7 million smoke alarms have been installed in homes across the U.S. and nearly 600 lives have been saved. In 2016, DataKind DC helped develop an interactive, open-source map that summarizes fire risk at the county and census tract levels (Home Fire Risk Map). For the past three years, this tool has been used by ARC and its partners to target at-risk areas for campaign events, allowing them to concentrate their efforts in areas that are most vulnerable.
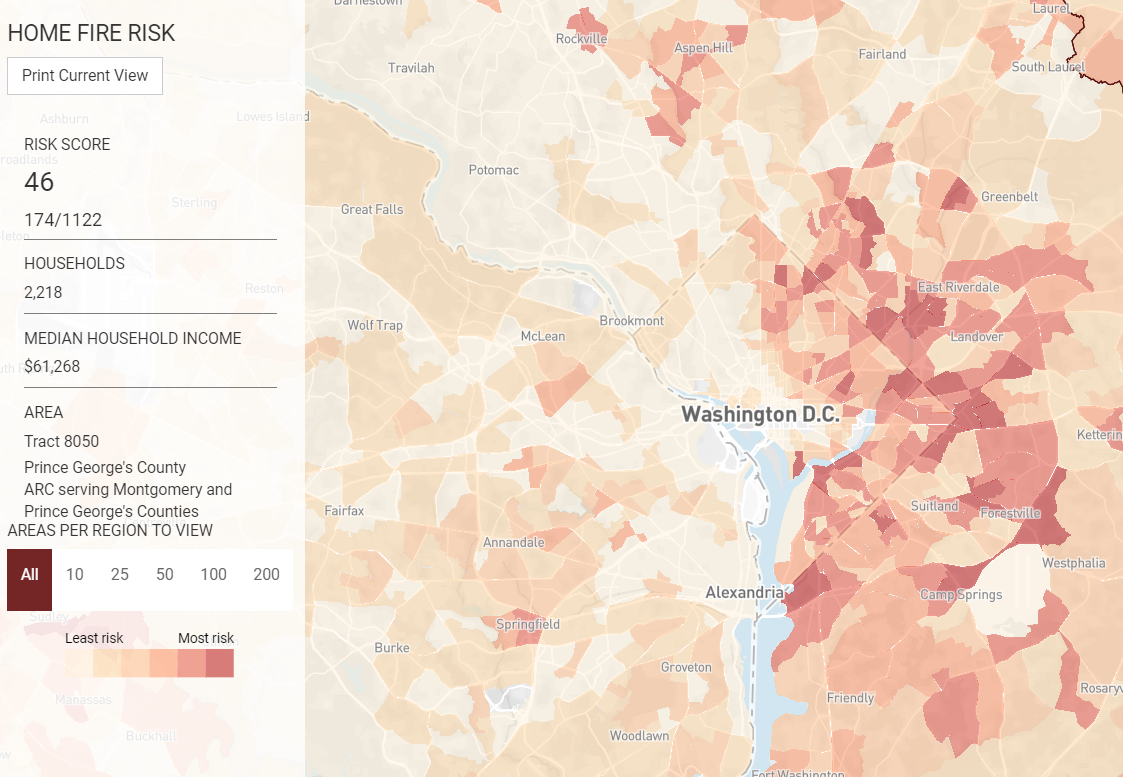
During the DataDive, volunteers helped to clean and aggregate new data that will feed into an updated model for home fire risk. Since the launch of the Home Fire Risk Map, new and updated datasets have been made publicly available that will help add additional value to the tool. The team’s first task was to combine data from disparate sources and uncover any patterns and features of an area that may demonstrate a relationship to the number of fires and fire-related fatalities in an area. In addition, DataDive volunteers began analyzing the impact of ARC’s Home Fire Prevention Campaign by incorporating ARC proprietary data, including where smoke alarms have been installed, into our analysis.

In order to get a sense of the scope of our new data, DataDive volunteers created interactive dashboards that allow for improved visual exploration.

Thank You
For the DataDive, we were graciously hosted by the George Washington University Department of Decision Science. The Flatiron School provided a great breakfast to kick off the weekend. Thanks to both organizations!
Farewell
We’d like to take this opportunity to bid a fond farewell to our Chapter Leaders, Astrid and Judy. DataKind DC wouldn’t be anywhere near where it is without their contributions. Astrid and Judy started out as DataKind volunteers, then served as Data Ambassadors on some of our most important and high profile projects, and then quickly advanced to Chapter Leaders. Astrid and Judy became Chapter Leaders in 2016 and have led for the last three years.
 .
. 
During their tenure, they significantly advanced the participation and professionalism of the Chapter, in addition to continuing to contribute their quantitative skills to projects. Astrid and Judy were also critical behind the scenes to ensure events were run effectively. They participated in events with DataKind Chapter Leaders from around the world, and used these experiences to help lead key strategic and operational decisions for the DataKind DC Chapter. They did all of this with a smile, and ensured our Chapter operated with the highest ethical standards. Even though they’re stepping down from their leadership positions, they plan to remain active in the community. We’re looking forward to their continued contributions!
Join Us
We’d love to see you at the next DataDive or Meetup! Join our Meetup group or follow us on Twitter for the latest news of how you can get involved.