American Red Cross |  Washington, DC
Objectives
- Prepare and anonymize never-before-released American Red Cross domestic disaster data and open data to gain insights
- Explore the data descriptively with statistics and visually with maps and graphics to understand data quality and identify patterns
- Prototype a model that predicts and maps which counties American Red Cross should target for its next smoke alarm installation campaigns
Findings
- Initial county-level recommendations of where American Red Cross should target its smoke alarm installation campaigns
Question
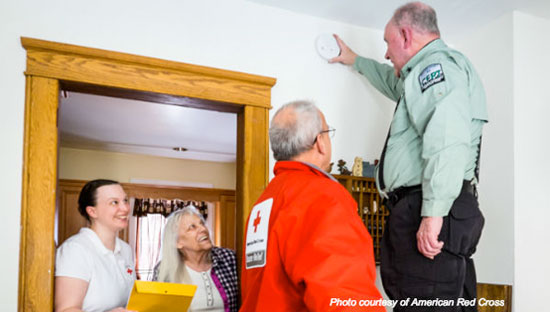
On average, seven people die every day from home fires in the U.S., resulting in over $7 billion in property damage each year. According to the National Fire Protection Association, the risk of dying in home fires is cut in half in homes with working smoke alarms.
In addition to the roughly 190 home fire and other events that the Red Cross responds to everyday, they launched the Home Fire Campaign in October 2014 with a goal of reducing fire-related injuries and deaths in the U.S. by 25% within 5 years.
The American Red Cross Information Management unit is charged with putting data in the hands of decision-makers before, during, and after major disasters in the U.S. They wondered how 5 years of past Red Cross home fire case data, smoke alarm install data, U.S. Fire Administration National Fire Incident Reporting System data, and open census data could be used to inform their efforts and predict where to target their future preparedness events at the local level.
What Happened
At a DataKind DC DataDive sponsored by Teradata, Data Ambassadors Juan Manuel Contreras, Andrew Brooks, and Korinne Chiu led a team of dedicated volunteers to work with Jonathan Loewus-Deitch from the American Red Cross to answer a number of questions.
Was Red Cross targeting smoke alarm and preparedness visits in high-risk communities? How could visualizing their data help drive organizational decision making? Did any open data sources exist that could be used in addition to other datasets to inform their efforts?

In just 24 hours, the team worked to answer these questions and more, exploring trends and visualizing the American Red Cross’ data on disasters, cases, and past smoke alarm installation campaigns. They also found open data sources like the American Community Survey and used county-level housing and demographic data to prototype two models that predict and map the U.S. counties most likely to see the largest uptake of smoke alarms. The results were county-level recommendations of where the American Red Cross should target new smoke alarm campaigns, showing a prediction of smoke alarm installs per visit.

Because the point density map above largely show populated areas, the volunteers also built a map showing the number of cases/clients per capita by county across the U.S.

What’s Next
The DataDive was so valuable, the Red Cross pushed this initiative into their core operations by refining their requirements for the next version of this predictive model. Over 50 DataKind DC volunteers workied with the organization over the course of a year to help build the final version of the Home Fire Risk Map that launched in June 2016.