DC Action for Children |  Washington, D.C.
Objectives
- Create an interactive databook to replace the traditional PDF factsheet, collecting crunched data on the indicators that have an impact on poverty.
- Present data on DC’s state of child well-being to child advocates, policymakers, and curious citizens using robust visualizations that incite action.
Findings
- One out of every three kids in DC lives in neighborhood that doesn’t have a single grocery store.
- Nearly half of the city’s children live in a neighborhood with a high concentration of child poverty.
- Schools with high graduation rates can be found across the city.
Question
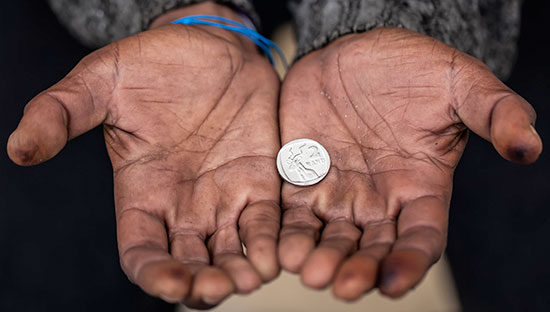
Did you know that three out of every ten kids in our nation’s capitol live in poverty? That’s about 40 percent more than the national average!
Well, visionary HyeSook Chung and her second in command at DC Action for Children, Gwen Rubenstein, know it. They attended our DC DataDive in March 2012 and threw down a challenge: build visualizations of traditional well-being data for kids living in DC that can be used to fight this battle against poverty.
These tools would be a huge step forward for the organization’s KIDS COUNT program. KIDS COUNT and similar programs typically produce static PDFs, which haven’t kept pace with state-of-the-art data crunching technology. DC Action, a small nonprofit, didn’t have the expertise or budget for such a project, but it had the drive and, most importantly, local knowledge on where to find the data.
What Happened
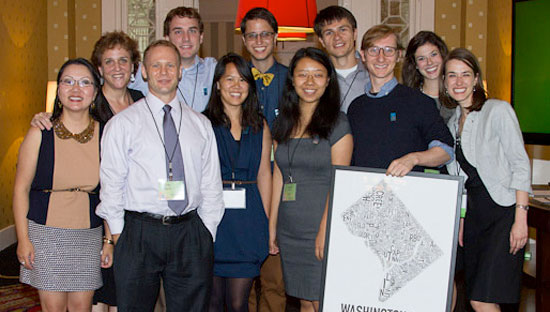
As luck would have it, we had some amazing geographic information systems (GIS) experts at the DC DataDive. Behind those top-notch skills, the team built an initial prototype using extensive neighborhood clustering. That effort launched months of tireless work by an amazing team of pro bono data crackerjacks—Team Awesome—collecting and visualizing all the key childhood well-being indicators supplied by DC Action. From there, the team created breakout data visualizations for each cross-tab we wanted to analyze. The final 2012 e-Databook debuted to a chorus of oohs and ahhs at the DC Action Annual Luncheon, in front of child advocates, DC Action supporters, and Mayor Vincent C. Gray.

Tools & Skills
- Statistical and data analysis, including the ability to join and merge datasets
- GIS expertise, including the ability to knit together different-shaped files and boundary data into new neighborhood bounds
- Data visualization design
- Front-end development in HTML, CSS, JavaScript
- Mapbox familiarity
What’s Next
This open source technology is there for the taking. It’s bringing change to Washington, DC. Other KIDS COUNT chapters across the country are chomping at the bit to pursue their own e-Databooks!
Read more
http://storify.com/mayurhpatel/data-passion-awesomeness-1?awesm=sfy.co_eO0
http://dcist.com/2014/05/four_maps_that_show_how_children_li.php